Sports Modelling and Data Visualization
, quality = 80")
From the early days of Button Networks’ founding, we have accumulated significant experience in performing statistical analysis and data visualizations.
Statistical Analysis
Here in Button Networks, thanks to our own projects in statistical analysis in the field of Sports Analytics, our Data Specialists are able to tackle any complex project that requires extensive data manipulation and work with databases that feature intricate table structures and a large amount of data.
Data manipulation and Statistics are deceptively prevalent; not only in fields like Sports Analytics, Financial Services and Medical Research and Development, but also in projects as innocuous as a custom E-Commerce platform. If you handle large amounts of raw data, you may be sitting on a treasure trove of information you may not even realize is there. Our Data Specialists are more than happy to help you take dig our these gold nuggets and take full advantage of your data.
However, manipulating data and getting the results one needs is typically only half the story.
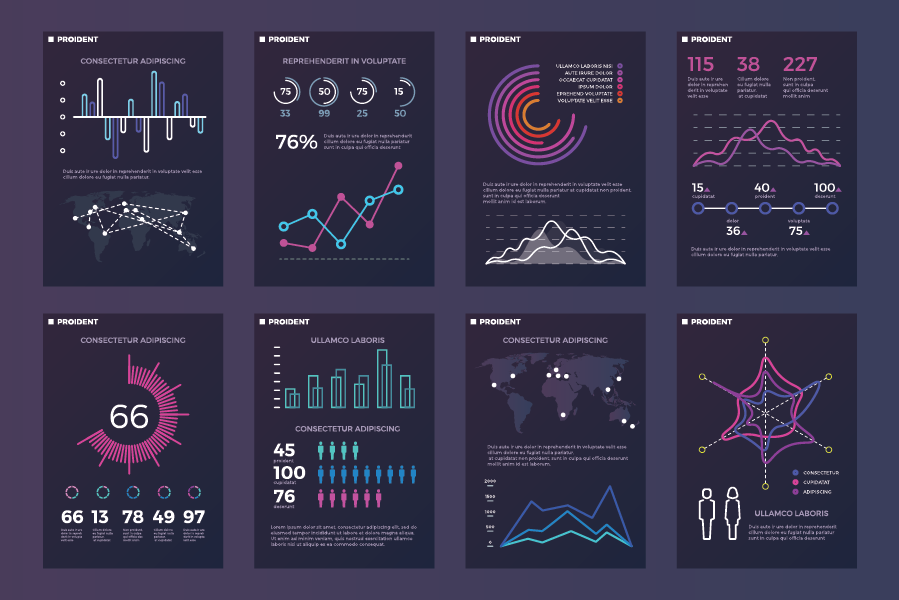
Data Visualizations
The UX/UI designers of Button Networks understand that getting the data our clients need in a format that is user-friendly and easily readable and comprehensive is of paramount importance. Hence, there is an emphasis in data presentation and visualization, as no data manipulation and statistical analysis is complete before the results are ready to be presented to the end-user.
We work closely with our clients to provide them with the data visualizations they need in order to extract the full benefits that visual representations of data provide. And if you are unsure what visual format might be the best suited for your data, our expertise is at your disposal for suggestions.
From the humble line graph, to the more intricate world of radial trees, Venn diagrams and R2 curves, our designers and data specialists will work closely with you to make the best of your data.